About FintechZoom

About FintechZoom

FintechZoom is a financial-market information platform that brings together market data, educational context and transparent status labels across stocks, cryptocurrency, ETFs and global indices — all in one accessible reading experience.

Whether you are checking a price, comparing market categories or learning about a financial instrument for the first time, FintechZoom is designed to make the surrounding information easier to read, navigate and question with confidence.

Sophisticated global financial district with modern architecture and subtle market-data displays

The platform

What Is FintechZoom?

FintechZoom is a web-based platform that organises financial-market information into clearly structured categories. Visitors can browse market data for stocks, cryptocurrency, exchange-traded funds, commodities, and regional indices across the United States, Europe and Asia — each presented with contextual explanations that help readers understand what the numbers represent.

The platform is built around the idea that a price or percentage change is more useful when accompanied by context. Each market page provides not just current data, but also explanations of market terminology, the significance of specific indices, and the broader conditions that can affect prices in that category.

Market pages on FintechZoom are organised by topic — from individual assets like Bitcoin to broader categories like US Markets Today. Each page follows a consistent structure: a data overview at the top, followed by detailed instrument tables, performance charts where available, and educational sections that explain the concepts behind the data.

This approach is designed for readers who want more than a ticker symbol and a number. FintechZoom aims to help visitors move from a quick overview to a more informed understanding of a market topic, using layered information that becomes more detailed as they scroll deeper into any given page.


Connected international financial markets with research screens showing global market data
Understanding global markets in context

Market categories

Explore Global Financial Markets

FintechZoom organises the world's financial markets into nine distinct categories, each with dedicated data, charts and educational context.

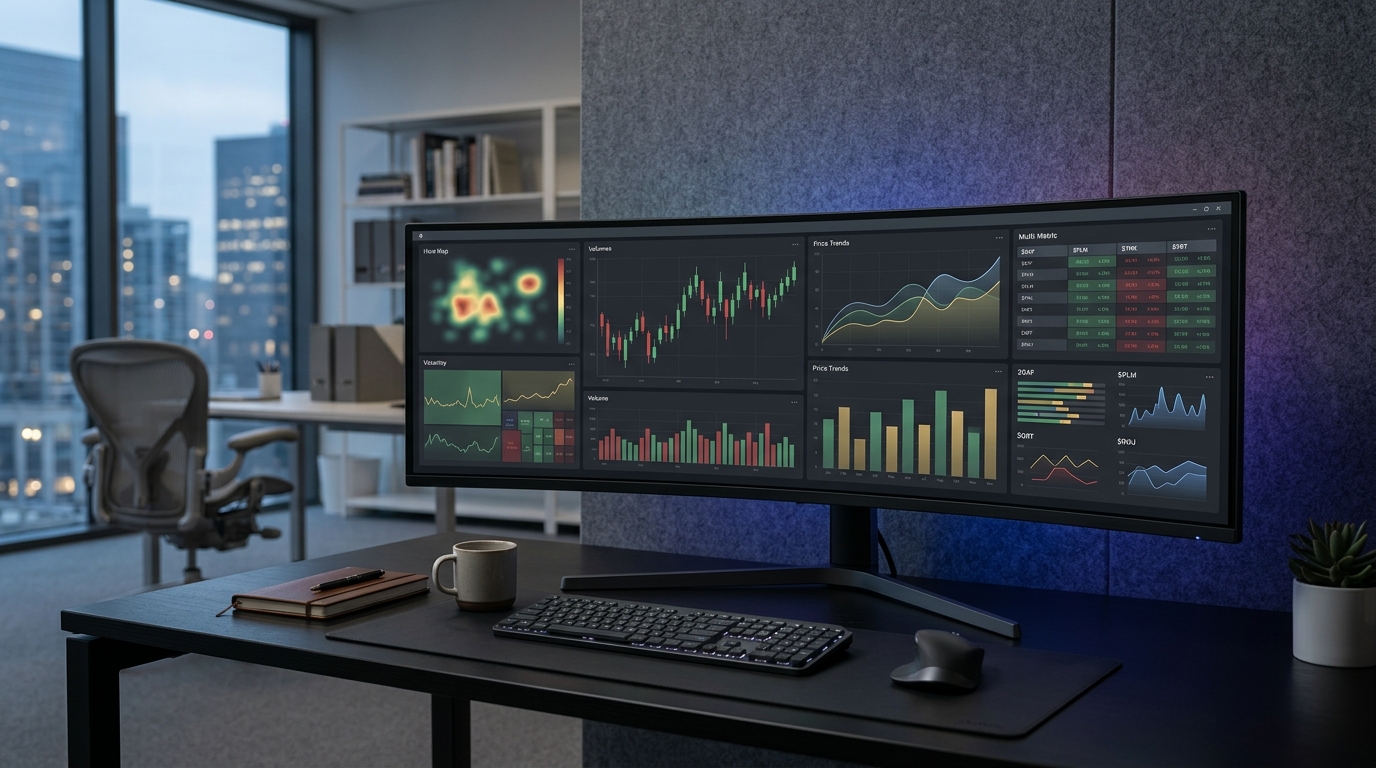
Premium financial research workspace with multiple displays showing market charts and data visualizations
Market information, structured for clarity

Navigating market data

Making Market Information Easier to Understand

FintechZoom presents financial information across several complementary formats, each designed to help visitors interpret what they are seeing rather than simply listing raw numbers.

  • Prices and percentage changesCurrent and recent price data is displayed alongside daily percentage changes, giving readers an immediate sense of both level and direction.
  • Indices and instrumentsMarket indices such as the S&P 500, Nasdaq, FTSE 100 and Nikkei 225 are presented with explanations of what each index tracks and why it is relevant.
  • Charts and historical contextWhere available, interactive charts display price movement over different timeframes, helping readers identify trends and compare performance periods.
  • Market sessions and regional contextRegional market pages note session hours and local market conditions, so readers understand when data is being actively updated versus outside trading hours.
  • Financial terminologyEach category page includes educational sections that explain relevant financial terms, making complex market language accessible to readers at any level of experience.

Our approach

Clarity, Context and Transparency

Three principles guide how information is structured and presented across FintechZoom. These are not marketing statements — they describe actual design decisions visible throughout the platform.

Clarity

Market information should be presented in an understandable structure. On FintechZoom, data is organised into consistent layouts — prices at the top, supporting detail below, educational context further down. Readers should be able to find what they are looking for without deciphering a cluttered interface. Each market page follows the same structural logic, so the experience remains familiar whether you are viewing stocks, crypto or European indices.

Context

A price or daily change becomes more useful when readers understand the instrument, timeframe and relevant market conditions. FintechZoom pairs data with explanatory content — describing what an index measures, why a sector is moving, or how a financial term should be interpreted. Context transforms isolated numbers into meaningful information that readers can use as a starting point for their own research.

Transparency

Visitors should be able to distinguish provider-backed information from delayed, stale, unavailable or simulated development data. FintechZoom uses visible status labels and badges throughout the interface to indicate the current state of market data. When the platform is running in demo mode or when a data connection is unavailable, this is clearly marked — not hidden. Transparency means readers always know what they are looking at.

Modern data analysis workstation displaying financial dashboards with status indicators and contextual views
Transparent data presentation with visible status labels

Who it's for

Built for Different Market Readers

FintechZoom is designed to serve a range of visitors — from people encountering financial markets for the first time to experienced readers who want a quick, well-organised overview of multiple market categories in one place.

01

Beginners learning financial terminology

Each market page includes educational sections that explain core financial concepts, market mechanics and commonly used terms — making the platform accessible even if you have never followed financial markets before.

02

Readers comparing market categories

The platform's nine market pages are structured consistently, making it straightforward to switch between stocks, cryptocurrency, ETFs and regional indices to compare performance, trends and key instruments.

03

Visitors checking available prices

FintechZoom provides quick access to current prices, daily changes and market status for major instruments — useful for readers who want a fast overview without searching across multiple platforms.

04

Readers who want context before further research

For visitors who plan to research a financial topic in more depth, FintechZoom provides a contextual starting point — explaining what an instrument is, how its market works and what factors typically influence its price.

Financial information being studied with notebooks, screens and printed charts on a well-lit workspace
Accessible financial learning for every experience level

Getting started

How to Explore FintechZoom

Navigating FintechZoom follows a simple three-step pattern, designed to take you from a broad market overview to specific, contextual information.

1

Choose a market category

Start on the homepage or use the navigation to select a market area — Stocks, Nasdaq, Bitcoin, Crypto, Investments, ETF Market, Asian Markets, European Markets or US Markets.

2

Explore the available market information

Each category page presents current data for key instruments, performance charts where available, market movers and supporting metrics — all in a consistent, scrollable layout.

3

Read the context and explanations

Scroll further to find educational sections, terminology explanations and market context that help you understand what the data means and how to interpret it for your own purposes.

Important information

Understanding Platform Limitations

FintechZoom is an informational platform. The market data displayed across the site may be delayed, stale, incomplete or temporarily unavailable depending on the status of external data providers and connection state. The platform uses visible status labels to indicate when data is connected, delayed, unavailable or running in simulated development mode.

When the platform is operating in demo mode or when provider connections are unavailable, simulated data may be displayed. Simulated information is not real market data and should not be used for any financial decision-making. The interface clearly marks simulated data with visible badges and labels.

Educational content and explanatory information on FintechZoom is intended to help readers understand financial concepts and market terminology. This content does not constitute personalised investment advice, financial guidance, tax advice or legal recommendations. Readers should consult qualified professionals before making any financial decisions.

For more details, please review our Financial Information Disclaimer, Terms of Service and Privacy Policy.

Get in touch

Connect with FintechZoom

Explore our market pages or reach out directly — we're here to help you navigate the world of financial market information.